기술문서
>HTML/CSS
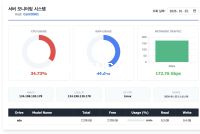
서버 인프라 모니터링용 front-end UI Sample
자료 기본정보
주요 프로그램 스펙
- 평점: 10.0
- 라이선스: free
피드백 및 다운로드
- 사용자 평점: 10.0
- 조회: 169
제조사 및 등록 정보
- 제작사: LUZENSOFT
- 등록일: 2026-01-25 11:14:53
> 설명
최종 압축형 서버 인프라 관리 대시보드
HTML
<!DOCTYPE html>
<html lang="ko">
<head>
    <meta charset="UTF-8">
    <title>Server Master List (Compact)</title>
    <script src="https://code.jquery.com/jquery-1.9.1.min.js"></script>
    <script src="https://cdn.jsdelivr.net/npm/chart.js"></script>
    <script src="https://cdn.tailwindcss.com"></script>
    <style>
        @import url('https://fonts.googleapis.com/css2?family=JetBrains+Mono:wght@500&family=Inter:wght@400;700&display=swap');
        body { font-family: 'Inter', sans-serif; letter-spacing: -0.01em; }
        .font-mono { font-family: 'JetBrains Mono', monospace; }
        /* 행 높이 최소화 */
        .compact-table td { padding: 4px 8px !important; line-height: 1.2; }
        .mini-chart { width: 32px !important; height: 32px !important; }
    </style>
</head>
<body class="bg-gray-100 p-4">

<div class="w-[900px] mx-auto bg-white shadow-lg rounded-lg overflow-hidden">
    <div class="bg-slate-800 p-3 flex justify-between items-center">
        <h1 class="text-white font-bold text-sm uppercase tracking-tight">Infrastructure Master List</h1>
        <div class="flex items-center gap-3">
            <input type="date" id="search_date" class="bg-slate-700 border-none rounded text-[11px] text-white px-2 py-1 outline-none">
            <span id="last_sync" class="text-[10px] text-slate-400 font-mono"></span>
        </div>
    </div>

    <div class="overflow-x-auto">
        <table class="w-full text-left border-collapse compact-table">
            <thead>
                <tr class="bg-slate-50 text-slate-500 text-[9px] font-black uppercase border-b">
                    <th class="p-2 text-center w-12">ID/P</th>
                    <th class="p-2 w-32">Host / Job</th>
                    <th class="p-2 w-32">Network (WAN/LAN)</th>
                    <th class="p-2 text-center">CPU/RAM</th>
                    <th class="p-2 text-center">Traffic</th>
                    <th class="p-2 text-center">Disk (U/IO)</th>
                    <th class="p-2">Utime / Mutime</th>
                    <th class="p-2 text-right">Action</th>
                </tr>
            </thead>
            <tbody id="server_list_body" class="divide-y divide-gray-100 text-[11px]">
                </tbody>
        </table>
    </div>
</div>

<script>
function fetchServerList() {
    var rawDate = $('#search_date').val().replace(/-/g, "");

    $.ajax({
        url: 'fetch_server_list.php',
        type: 'GET',
        data: { date: rawDate },
        dataType: 'json',
        success: function(data) {
            var html = '';
            $.each(data, function(idx, s) {
                var isPM = (s.pno == 0 || !s.pno);
                var rowBg = isPM ? 'bg-white' : 'bg-gray-50/50';

                html += '<tr class="' + rowBg + ' hover:bg-blue-50 transition-colors">';

                // 1. ID / PNO
                html += '<td class="text-center font-mono text-[10px] border-r border-gray-100">';
                html += '  <div class="font-bold text-slate-800">' + s.no + '</div>';
                html += '  <div class="text-slate-300 scale-90">' + (isPM ? '-' : s.pno) + '</div>';
                html += '</td>';

                // 2. Hostname / OS / Job
                html += '<td>';
                html += '  <div class="flex items-center gap-1">';
                html += '    <span class="font-bold text-slate-700 truncate max-w-[80px]">' + s.hn + '</span>';
                html += '    <span class="text-[8px] px-0.5 bg-gray-200 text-gray-500 rounded">' + s.os + '</span>';
                html += '  </div>';
                html += '  <div class="text-[9px] text-blue-500 font-medium truncate italic">' + s.job + '</div>';
                html += '</td>';

                // 3. WAN / IP
                html += '<td>';
                html += '  <div class="font-semibold text-slate-600">' + s.wan + '</div>';
                html += '  <div class="text-[10px] text-slate-400">' + s.ip + '</div>';
                html += '</td>';

                // 4. CPU / RAM (초소형 차트)
                html += '<td class="flex justify-center gap-2 items-center">';
                html += '  <div class="text-center"><canvas id="cpu_'+s.no+'" class="mini-chart"></canvas><p class="text-[8px] mt-[-2px]">'+Math.round(s.cpu)+'%</p></div>';
                html += '  <div class="text-center"><canvas id="ram_'+s.no+'" class="mini-chart"></canvas><p class="text-[8px] mt-[-2px] text-pink-500">'+Math.round(s.ram)+'%</p></div>';
                html += '</td>';

                // 5. Traffic
                html += '<td class="text-center font-bold text-slate-600">' + parseFloat(s.traffic).toFixed(1) + '<span class="text-[8px] ml-0.5 font-normal">M</span></td>';

                // 6. Disk Usg / IO
                html += '<td class="text-center">';
                html += '  <div class="text-emerald-600 font-bold">' + s.disk_usg + '%</div>';
                html += '  <div class="text-[9px] text-slate-400">IO:' + Math.round(s.disk_io) + '</div>';
                html += '</td>';

                // 7. Utime / Mutime (가로 배치로 높이 절약)
                html += '<td class="text-[9px] text-slate-500 whitespace-nowrap">';
                html += '  <div><span class="text-slate-300">U:</span> ' + s.utime + '</div>';
                html += '  <div><span class="text-blue-300 font-bold">M:</span> ' + s.mutime + '</div>';
                html += '</td>';

                // 8. Actions
                html += '<td class="text-right pr-2">';
                html += '  <div class="flex justify-end gap-1 scale-90">';
                html += '    <button onclick="editServer('+s.no+')" class="p-1 bg-slate-100 rounded hover:bg-blue-500 hover:text-white transition-colors"><svg width="10" height="10" viewBox="0 0 24 24" fill="none" stroke="currentColor" stroke-width="3" stroke-linecap="round" stroke-linejoin="round"><path d="M17 3a2.828 2.828 0 1 1 4 4L7.5 20.5 2 22l1.5-5.5L17 3z"/></svg></button>';
                html += '    <button onclick="deleteServer('+s.no+')" class="p-1 bg-slate-100 rounded hover:bg-red-500 hover:text-white transition-colors"><svg width="10" height="10" viewBox="0 0 24 24" fill="none" stroke="currentColor" stroke-width="3" stroke-linecap="round" stroke-linejoin="round"><path d="M3 6h18"/><path d="M19 6v14c0 1-1 2-2 2H7c-1 0-2-1-2-2V6"/><path d="M8 6V4c0-1 1-2 2-2h4c1 0 2 1 2 2v2"/></svg></button>';
                html += '  </div>';
                html += '</td>';

                html += '</tr>';
            });

            $('#server_list_body').html(html);
            $('#last_sync').text('Sync: ' + new Date().toLocaleTimeString());

            // 초소형 차트 렌더링
            $.each(data, function(idx, s) {
                renderMini('cpu_' + s.no, s.cpu, '#6366f1');
                renderMini('ram_' + s.no, s.ram, '#ec4899');
            });
        }
    });
}

function renderMini(id, val, color) {
    var ctx = document.getElementById(id).getContext('2d');
    new Chart(ctx, {
        type: 'doughnut',
        data: { datasets: [{ data: [val, 100 - val], backgroundColor: [color, '#f1f5f9'], borderWidth: 0 }] },
        options: { cutout: '75%', responsive: false, maintainAspectRatio: true, plugins: { legend: { display: false }, tooltip: { enabled: false } } }
    });
}

$(document).ready(function() {
    var now = new Date();
    var today = now.getFullYear() + '-' + ('0' + (now.getMonth() + 1)).slice(-2) + '-' + ('0' + now.getDate()).slice(-2);
    $('#search_date').val(today);
    fetchServerList();
});
</script>

</body>
</html>
📦 포함된 모든 데이터 항목 및 배치 방식
데이터 키 | 표시 위치 / 방식 |
|---|---|
no / pno | ID/Parent 컬럼에 위아래로 배치. 상하관계 즉시 확인. |
hn / os / job | Host / Job 컬럼에 배치. OS는 배지 형태로, Job은 이탤릭체로 작게 표시. |
wan / ip | Network 컬럼에 위아래로 배치. |
cpu / ram | Resources 컬럼에 초소형 도넛 차트 + 수치(%)로 표시. |
traffic | Traffic 컬럼에 소수점 1자리까지 표시. |
disk_usg / disk_io | Disk 컬럼에 사용률(%)과 IO 수치를 조합하여 표시. |
utime / mutime | Time 컬럼에 나란히 배치. Mutime(마지막 업데이트)은 파란색으로 강조. |
🚀 최소화(Compact) 설계 포인트
Padding 최적화:
compact-table td에 패딩을 4px로 줄여 행 간격을 극도로 좁혔습니다. 한 화면(노트북 기준)에 약 15~20대 이상의 서버가 동시에 보입니다.초소형 차트: Chart.js 크기를 32px로 고정하여 데이터 확인과 시각적 효과를 동시에 잡았습니다.
900px 고정: 모든 컬럼의 너비를
w-32,w-20등으로 조절하여 900px 안에서 가로 스크롤 없이 모든 항목이 정렬됩니다.